Before we start #
In this guide I will show you how to Setup Elasticsearch, Kibana and the Elastic Agent managed by Fleet to collect IIS Logs and create your own Ingest Pipeline. The Pipeline will also do geolocation lookup and break down the User Agent in multiple parts.
I’ll show you the setup in a test environment consisting of 2 Windows Server 2022, one for the ELK Stack and one providing a minimal IIS installation with the default site.
Installation of Elasticsearch and Kibana #
Download #
Get both Elasticsearch and Kibana downloaded to the Server you want to use them on. I use version [8.3.3] of Elasticsearch and Kibana.
Download Elasticsearch | Elastic
Download Kibana Free | Get Started Now | Elastic
Extract the content of both archives to your preffered location. I’m going to place them in C:\ElasticStack.
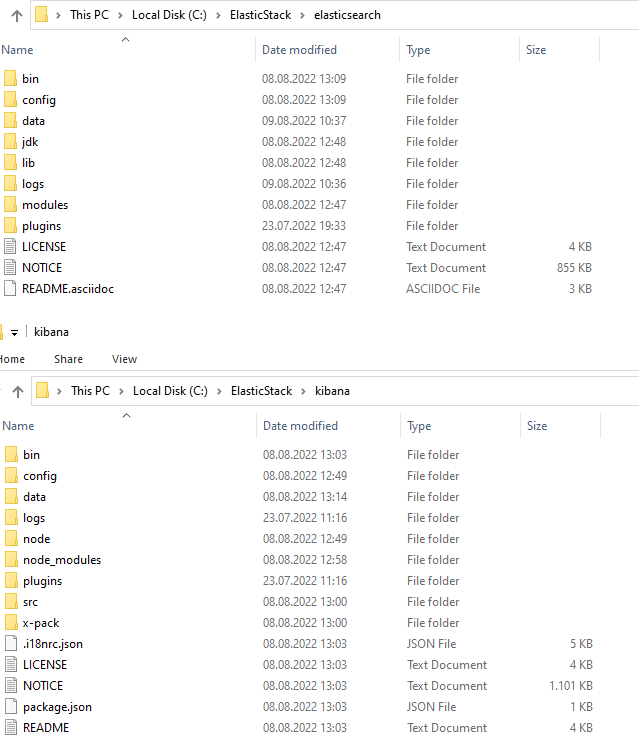
If you use the same paths as I do, you can just use the PowerShell snippets I provide.
First start of Elasticsearch and Kibana #
First we need to start Elasticsearch once to get the Enrollment token and our elastic users password.
cd C:\ElasticStack\elasticsearch\bin; .\elasticsearch.bat

Next start Kibana in a new PowerShell. This can take a bit longer then starting Elasticsearch for the first time
cd C:\ElasticStack\kibana\bin; .\kibana.bat
When started successfully, you’ll get a link to the quicksetup of Kibana.

Open it and enter the Enrollment Token, finish the setup with Configure Elastic
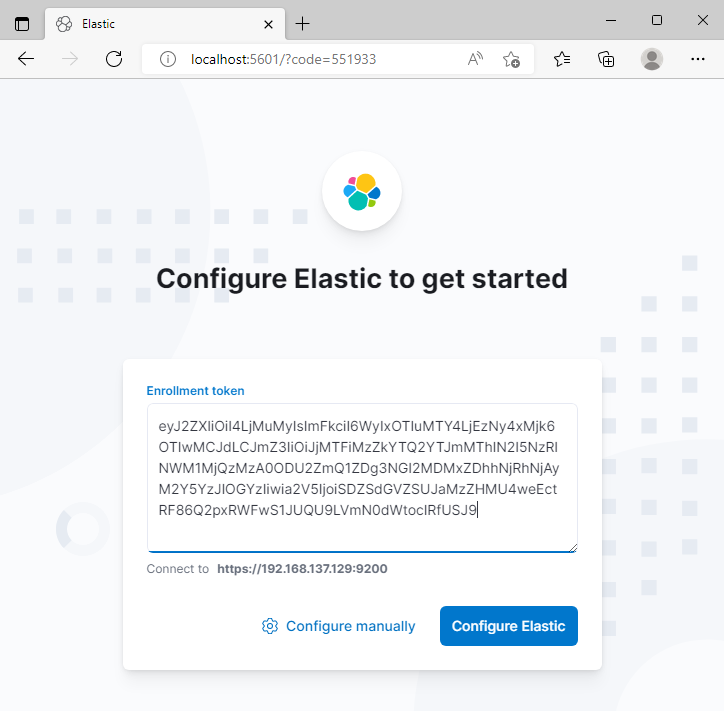
After the Initial setup is completed try to login with your elastic user and you will see the Welcome page. We’re going to stop Elasticsearch and Kibana for now and setup the automatic Startup for them.
Automatic startup via Windows Task Scheduler #
You can of course use your Administrator Account for the Task Scheduler Job but a dedicated account should be considered for security reasons.
If you got an Active Directory you can use a gMSA for this. I will go with a Local User Account and grant it Logon as a batch job
- Create the user Account
New-LocalUser -Name "elastic" -Description "User for Elastic Stack." -Password (ConvertTo-SecureString -AsPlainText "SuperSecurePassword123" -Force)
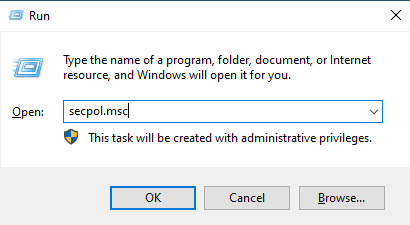
2. Open secpol.msc
3. Navigate to Local Policies -> User Rights Assignment -> Log on as a batch job
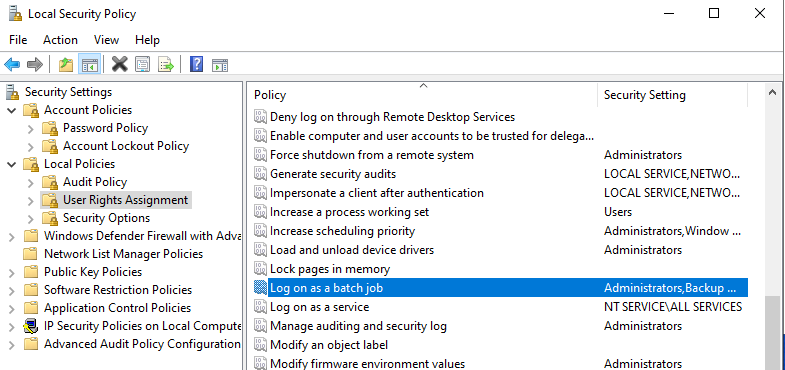
4. Add your user account
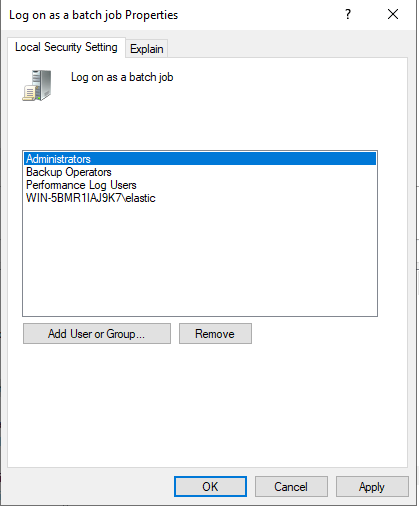
5. Set ACLs for the Folder to give our user access to it
#Get Current ACL of the Folder
$Acl = Get-Acl "C:\ElasticStack"
#Adjust ACLs
$Ar = New-Object System.Security.AccessControl.FileSystemAccessRule("elastic", "FullControl", "ContainerInherit,ObjectInherit", "None", "Allow")
$Acl.SetAccessRule($Ar)
#Save new ACL to the Folder
Set-Acl "C:\ElasticStack" $Acl
6. Setup the Scheduled Task for Elasticsearch and Kibana and start them
#Setup Task for Elasticsearch
$ElasticTaskAction = New-ScheduledTaskAction -Execute "C:\ElasticStack\elasticsearch\bin\elasticsearch.bat"
$ElasticTaskTrigger = New-ScheduledTaskTrigger -AtStartup
$ElasticTaskSettings = New-ScheduledTaskSettingsSet -ExecutionTimeLimit 0
$TaskPrincipal = New-ScheduledTaskPrincipal -Id "Author" -UserId "elastic" -LogonType Password -RunLevel Limited
$ElasticTask = New-ScheduledTask -Action $ElasticTaskAction -Trigger $ElasticTaskTrigger -Settings $ElasticTaskSettings -Principal $TaskPrincipal
Register-ScheduledTask -TaskName "Elasticsearch" -InputObject $ElasticTask -TaskPath "\ElasticStack" -User "elastic" -Password "SuperSecurePassword123"

#Setup Task for Kibana
$KibanaTaskAction = New-ScheduledTaskAction -Execute "C:\ElasticStack\kibana\bin\kibana.bat"
$KibanaTaskTrigger = New-ScheduledTaskTrigger -AtStartup
$KibanaTaskSettings = New-ScheduledTaskSettingsSet -ExecutionTimeLimit 0
$KibanaTask = New-ScheduledTask -Action $KibanaTaskAction -Trigger $KibanaTaskTrigger -Settings $KibanaTaskSettings -Principal $TaskPrincipal
Register-ScheduledTask -TaskName "Kibana" -InputObject $KibanaTask -TaskPath "\ElasticStack" -User "elastic" -Password "SuperSecurePassword123"

#Start both Tasks
Start-ScheduledTask -TaskPath \ElasticStack -TaskName Elasticsearch
Start-ScheduledTask -TaskPath \ElasticStack -TaskName Kibana
Setup Fleet and the Elastic Agent #
In this part we’re going to setup Fleet. Fleet is our centralized place to manage all Elastic Agents, deploy new Policys and make changes to integrations etc.
Setup Fleet #
- In Kibana, go to Management -> Fleet
- Set IP Address of the Fleet host – I use the IP of the host where Elastic and Kibana are running
- Generate Fleet Server policy
If you want more control, use the Advanced tab to change your Fleet Server policy.
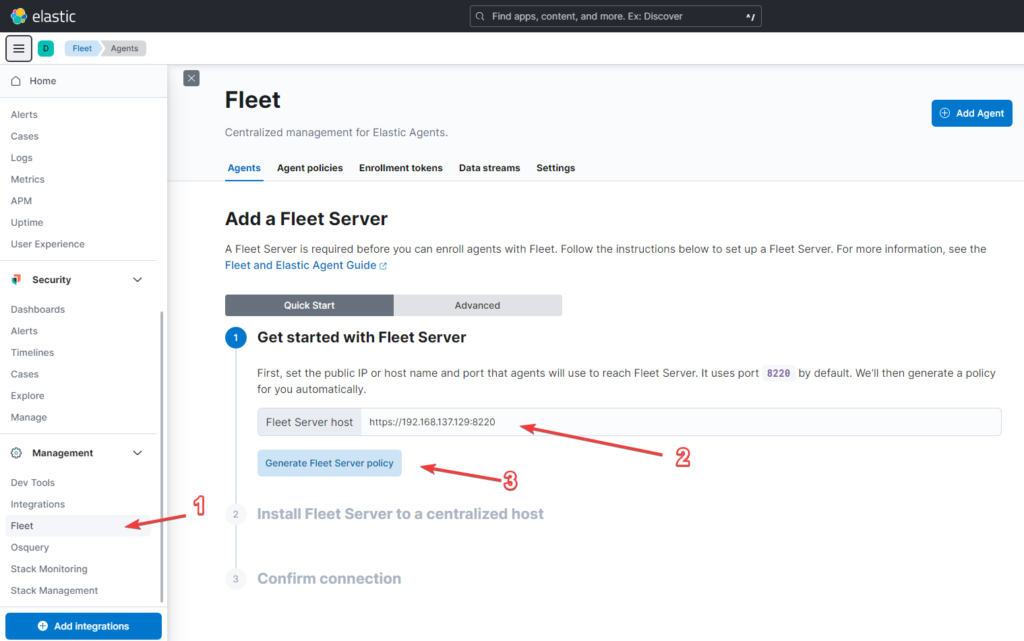
Now we install Fleet on the with the provided Powershell snippet.
Don’t use the PowerShell ISE here, the installation process won’t start.
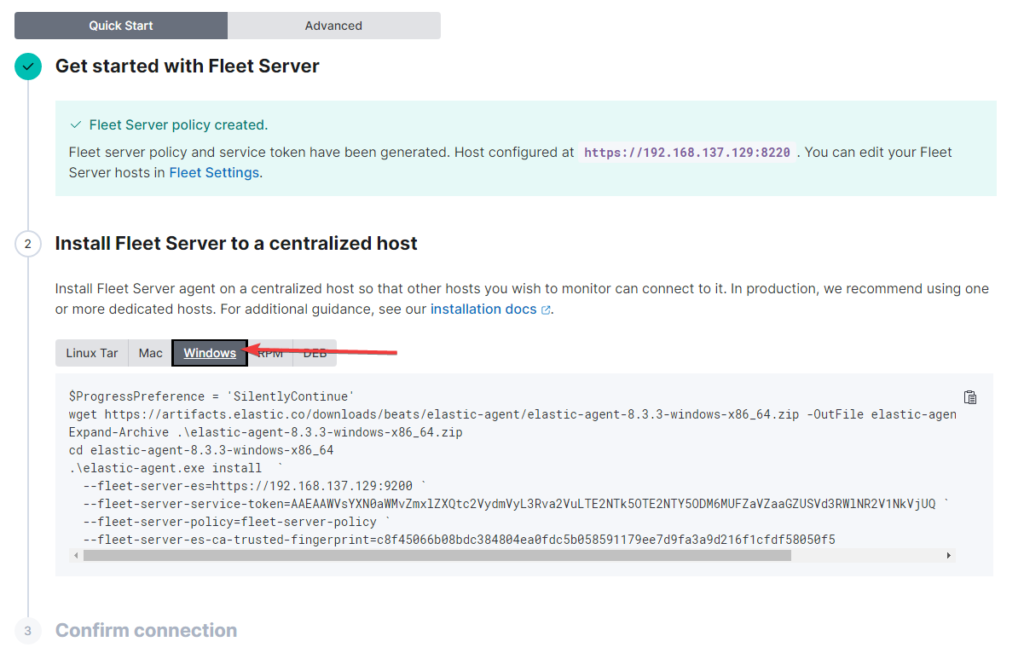
If the installation fails with this error, use cd .\elastic-agent-8.3.3-windows-x86_64\ to navigate into the right folder and retry the installation part beginning with .\elastic-agent.exe install
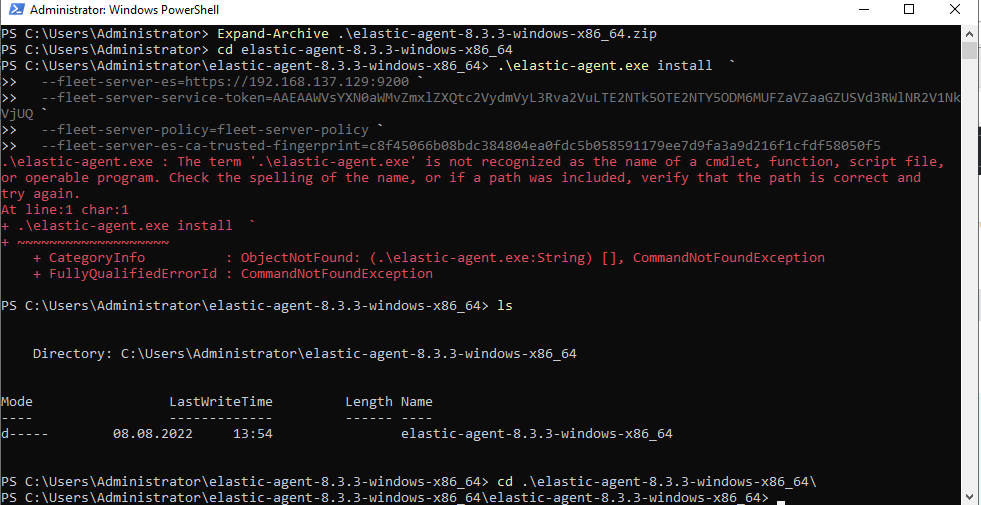
Accept the following prompt with a Y input and wait.

Now we’re heading back to Kibana to check if the install was successful.
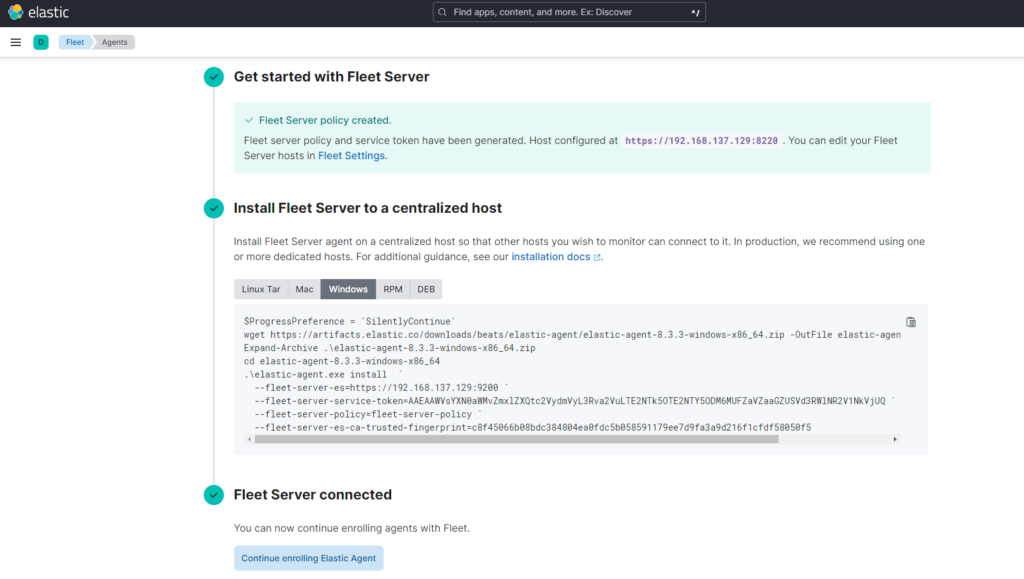
As a last step we need to Allow the connection to our Fleet Server and Elasticsearch through the Windows Firewall. I will limit acces to my IIS Servers IP only with the -RemoteAddress parameter.
New-NetFirewallRule -DisplayName "Fleet Server" -Protocol TCP -LocalPort 8220 -RemoteAddress "192.168.137.128"
New-NetFirewallRule -DisplayName "Elasticsearch Server" -Protocol TCP -LocalPort 9200 -RemoteAddress "192.168.137.128"
Setup Elastic Agent on our IIS Server #
- From the Fleet overview, click on Add Agent
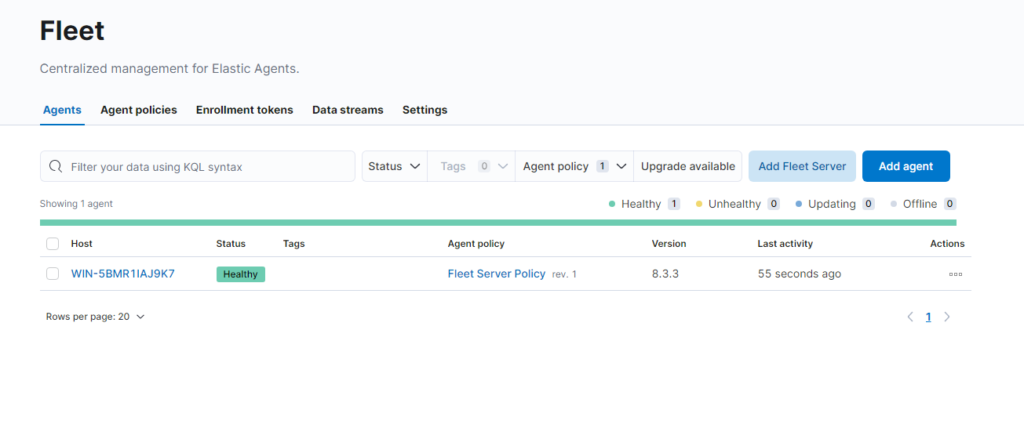
- Create a new agent policy and adjust it to your needs. I will leave mine on default.
- Click on create policy
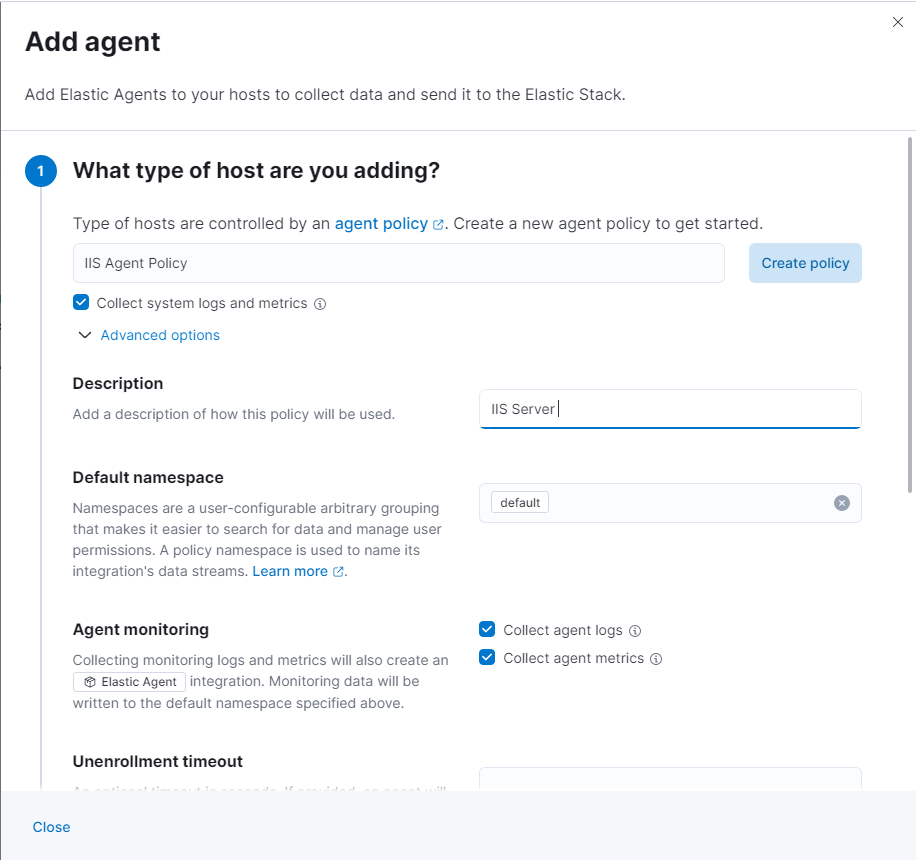
- It’s the same process as before but now we’re installing the agent on our IIS Server
- Maker sure you select Enroll in Fleet (recommended)
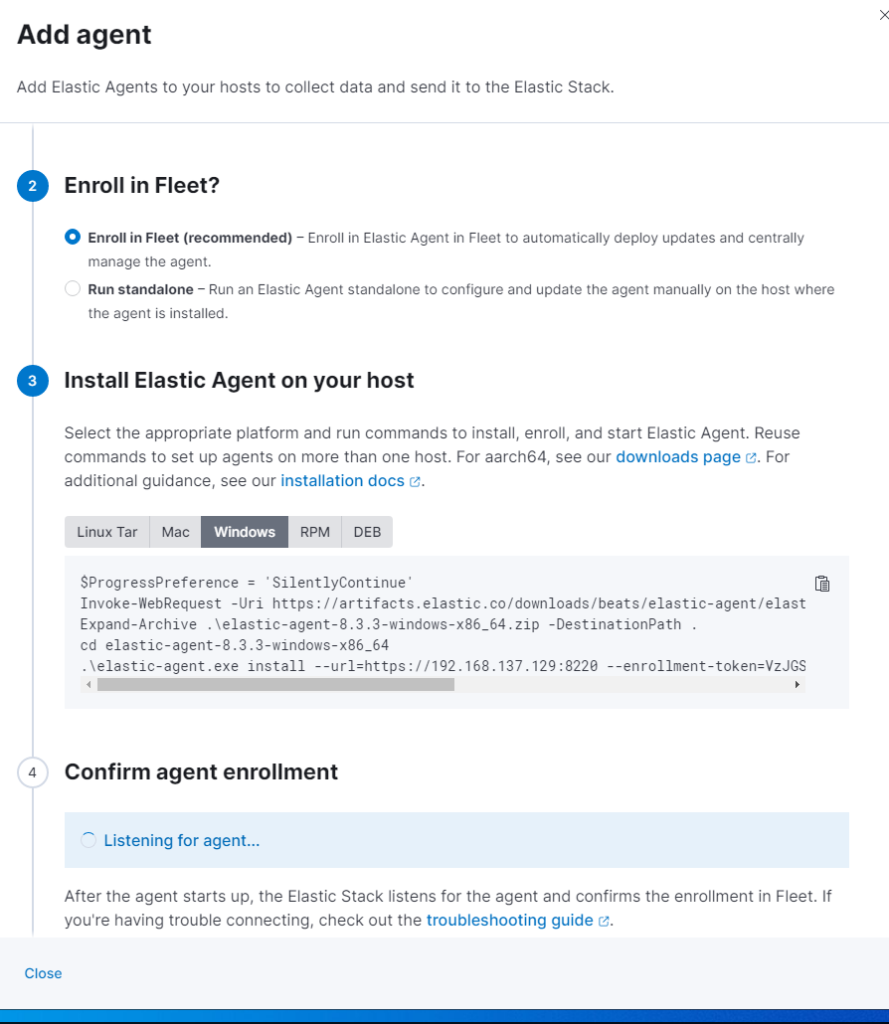
If we execute the provided code now it will fail because the certificate authority can’t be validate.
This is not a problem, Fleet created self signed certificates and will use it. We just need to add the –insecure parameter to our installation command like this:
.\elastic-agent.exe install --url=https://192.168.137.129:8220 --enrollment-token=VzJGSGY0SUJjMHpXYU5oWXFHRFg6c2RBR3psV2xUNUNuZElGOVYwRmItUQ== --insecure
When completed go back to Kibana and check if the Installation is completed.
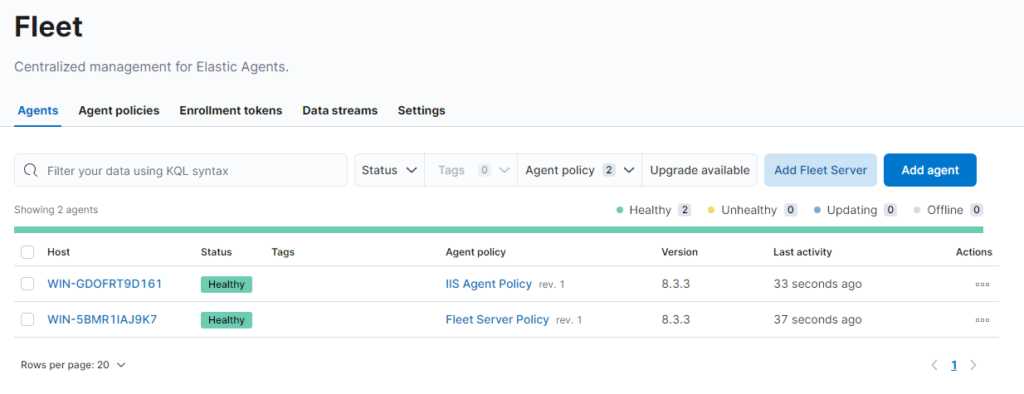
Prepare the IIS Logging settings #
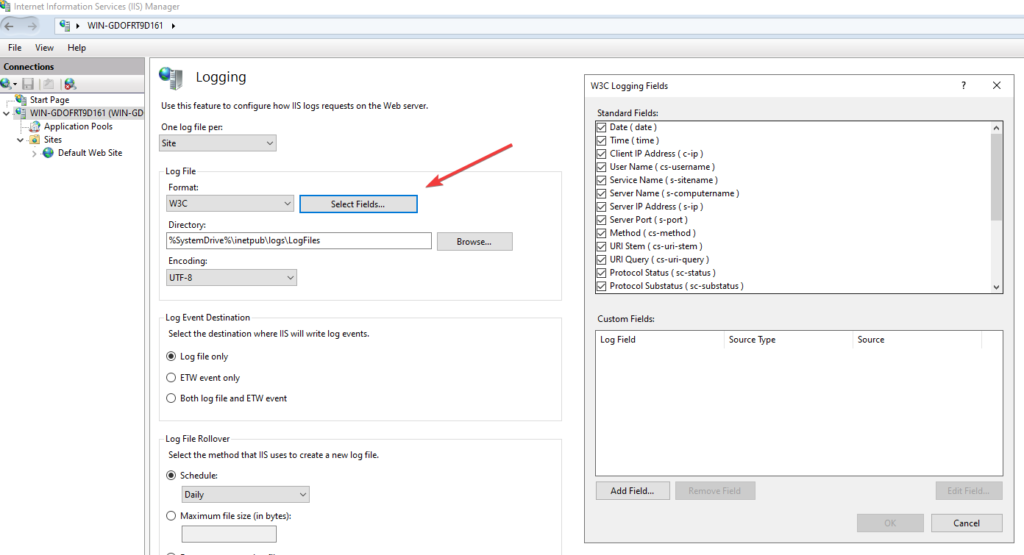
The pipeline is configured to use every available field from the IIS Logging. In the default IIS Configuration not every field is enabled, so the pipeline would fail.
To enable logging for all fields:
- Open IIS Manager -> {SERVERNAME / OR Site} -> Logging -> Select Fields…
- Check every field here
Create a Ingest Pipeline #
Every single line from our IIS Logs will pass the Ingest Pipeline and get matched to our pattern we define now.
We will use the templates I created from now on as I can’t go into every detail. For detailed Information please head to the Elastic Docs.
- Open Management -> Dev Tools -> Console.
PUT _ingest/pipeline/logs-iis
{
  "description": "Default IIS Log Pipeline\n",
  "processors": [
    {
      "grok": {
        "field": "message",
        "patterns": [
          "%{TIMESTAMP_ISO8601:date_time} %{WORD:s_sitename} %{HOSTNAME:s_computername} %{IP:s_ip} %{WORD:cs_method} %{URIPATH:cs_uri_stem} %{NOTSPACE:cs_uri_query} %{NUMBER:s_port} %{NOTSPACE:cs_username} %{IPORHOST:c_ip} %{NOTSPACE:cs_version} %{NOTSPACE:cs_user_agent_original} %{NOTSPACE:cs_cookie} %{NOTSPACE:cs_referer} %{NOTSPACE:cs_host} %{NUMBER:sc_status} %{NUMBER:sc_substatus} %{NUMBER:sc_win32_status} %{NUMBER:sc_bytes} %{NUMBER:cs_bytes} %{NUMBER:time_taken}"
        ]
      }
    },
    {
      "date": {
        "field": "date_time",
        "formats": [
          "yyyy-MM-dd HH:mm:ss"
        ]
      }
    },
    {
      "uri_parts": {
        "field": "cs_uri_stem",
        "target_field": "cs_uri_stem",
        "ignore_failure": true
      }
    },
    {
      "set": {
        "ignore_failure": true,
        "field": "cs_uri_stem.extension",
        "value": "no-extension",
        "override": false
      }
    },
    {
      "urldecode": {
        "field": "cs_user_agent_original",
        "ignore_missing": true
      }
    },
    {
      "user_agent": {
        "field": "cs_user_agent_original",
        "target_field": "cs_user_agent",
        "ignore_missing": true
      }
    },
    {
      "geoip": {
        "field": "c_ip",
        "target_field": "source.geo"
      }
    },
    {
      "geoip": {
        "field": "c_ip",
        "target_field": "source.as",
        "database_file": "GeoLite2-ASN.mmdb",
        "properties": [
          "asn",
          "organization_name"
        ],
        "ignore_missing": true
      }
    },
    {
      "rename": {
        "field": "source.as.asn",
        "target_field": "source.as.number",
        "ignore_missing": true
      }
    },
    {
      "rename": {
        "field": "source.as.organization_name",
        "target_field": "source.as.organization.name",
        "ignore_missing": true
      }
    }
  ],
  "on_failure": [
    {
      "set": {
        "field": "_index",
        "value": "failed-{{ _index }}"
      }
    }
  ]
}
- Change the red part to set another name for the Pipeline „PUT _ingest/pipeline/logs-iis„
- Paste everything into the console and send the request
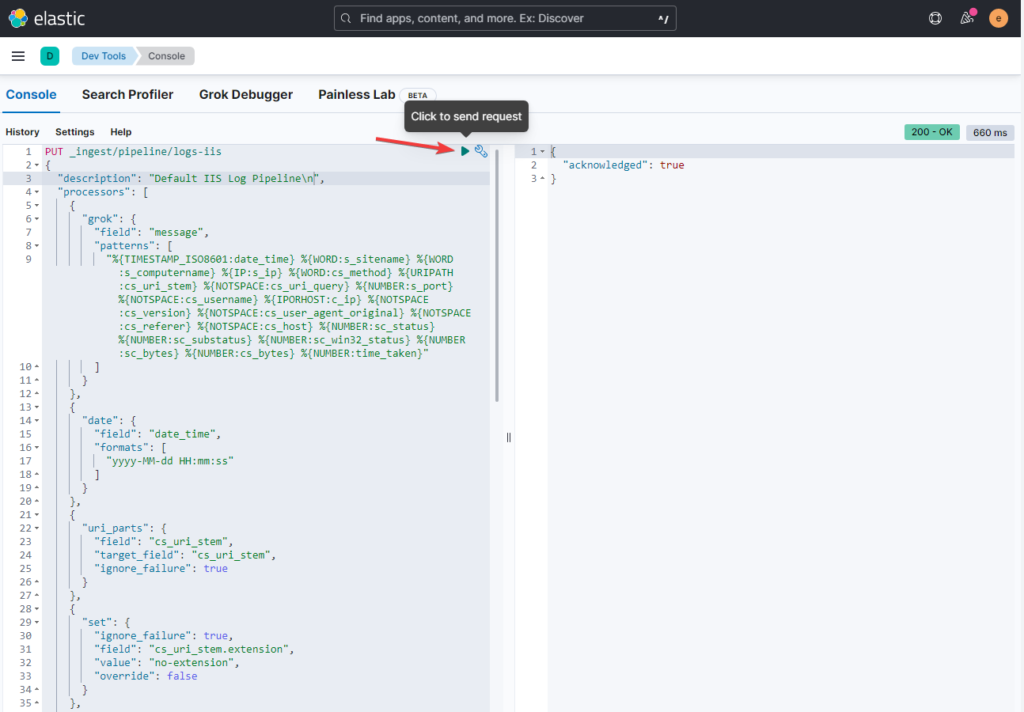
- If everything worked we get an
"acknowledged": true - To doublecheck open Management -> Stack Management -> Ingest Pipelines

Create a Component Template #
The Component Template will store all Mappings and Settings for our Index Template so we can reuse them without setting them in every Index Template we might create.
- Open Management -> Dev Tools -> Console and query the following JSON.
- Open Management -> Stack Management -> Index Management -> Component Templates to doublecheck if our Component got created.
PUT _component_template/logs-iis-template
{
  "template": {
    "mappings": {
      "_routing": {
        "required": false
      },
      "numeric_detection": true,
      "dynamic_date_formats": [
        "strict_date_optional_time",
        "yyyy/MM/dd HH:mm:ss Z||yyyy/MM/dd Z"
      ],
      "_source": {
        "excludes": [],
        "includes": [],
        "enabled": true
      },
      "dynamic": true,
      "dynamic_templates": [],
      "date_detection": true,
      "properties": {
        "cs_version": {
          "type": "keyword"
        },
        "s_port": {
          "type": "long"
        },
        "cs_method": {
          "type": "keyword"
        },
        "cs_host": {
          "type": "keyword"
        },
        "s_ip": {
          "type": "ip"
        },
        "cs_bytes": {
          "type": "long"
        },
        "cs_uri_stem": {
          "dynamic": true,
          "type": "object",
          "enabled": true,
          "properties": {
            "path": {
              "eager_global_ordinals": false,
              "norms": false,
              "index": true,
              "store": false,
              "type": "keyword",
              "index_options": "docs",
              "split_queries_on_whitespace": false,
              "doc_values": true
            },
            "extension": {
              "type": "keyword"
            },
            "original": {
              "type": "keyword"
            },
            "scheme": {
              "type": "keyword"
            },
            "domain": {
              "type": "keyword"
            }
          }
        },
        "source": {
          "type": "object",
          "properties": {
            "geo": {
              "type": "object",
              "properties": {
                "continent_name": {
                  "type": "keyword"
                },
                "region_iso_code": {
                  "type": "keyword"
                },
                "city_name": {
                  "type": "keyword"
                },
                "country_iso_code": {
                  "type": "keyword"
                },
                "country_name": {
                  "type": "keyword"
                },
                "location": {
                  "type": "geo_point"
                },
                "region_name": {
                  "type": "keyword"
                }
              }
            },
            "as": {
              "type": "object",
              "properties": {
                "number": {
                  "type": "long"
                },
                "organization": {
                  "type": "object",
                  "properties": {
                    "name": {
                      "type": "keyword"
                    }
                  }
                }
              }
            },
            "address": {
              "type": "keyword"
            },
            "ip": {
              "type": "ip"
            }
          }
        },
        "cs_referrer": {
          "type": "keyword"
        },
        "c_ip": {
          "type": "ip"
        },
        "time_taken": {
          "type": "long"
        },
        "cs_uri_query": {
          "type": "keyword"
        },
        "s_computername": {
          "type": "keyword"
        },
        "sc_status": {
          "type": "long"
        },
        "s_sitename": {
          "type": "keyword"
        },
        "cs_user_agent_original": {
          "type": "keyword"
        },
        "sc_substatus": {
          "type": "long"
        },
        "sc_bytes": {
          "type": "long"
        },
        "cs_username": {
          "type": "keyword"
        },
        "sc_win32_status": {
          "type": "long"
        },
        "cs_cookie": {
          "type": "keyword"
        }
      }
    }
  }
}
Create a Index Template #
The Index Template defines the Pipeline we use and also our index pattern.
If you changed the Component Template or the Pipelines name adjust them in the JSON now.
PUT _index_template/logs-iis.default
{
  "priority": 1000,
  "template": {
    "settings": {
      "index": {
        "lifecycle": {
          "name": "logs"
        },
        "default_pipeline": "logs-iis"
      }
    },
    "mappings": {
      "_routing": {
        "required": false
      },
      "numeric_detection": true,
      "dynamic_date_formats": [
        "strict_date_optional_time",
        "yyyy/MM/dd HH:mm:ss Z||yyyy/MM/dd Z"
      ],
      "dynamic": true,
      "_source": {
        "excludes": [],
        "includes": [],
        "enabled": true
      },
      "dynamic_templates": [],
      "date_detection": true
    }
  },
  "index_patterns": [
    "logs-iis*"
  ],
  "data_stream": {
    "hidden": false,
    "allow_custom_routing": false
  },
  "composed_of": [
    "logs-iis-template"
  ]
}
Open Management -> Stack Management -> Index Management -> IndexTemplates to doublecheck if our template got created.
Setup our Agent Integration #
To finally gather our data we need to create our Integration inside our Agent policy. To do so:
- Open Management -> Fleet -> IIS Agent Policy
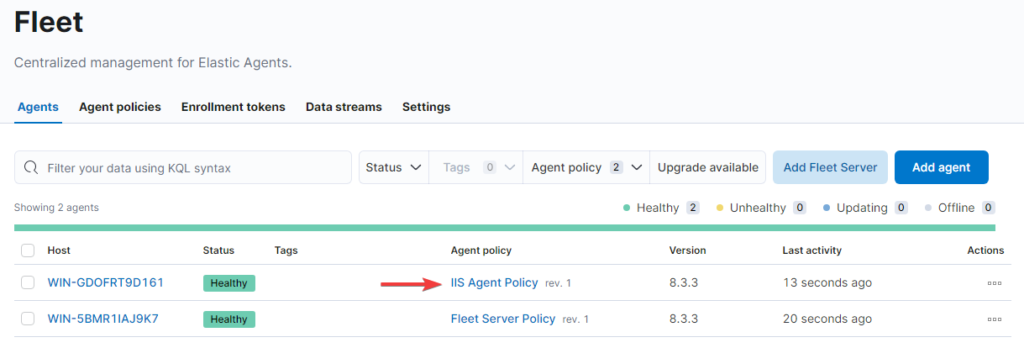
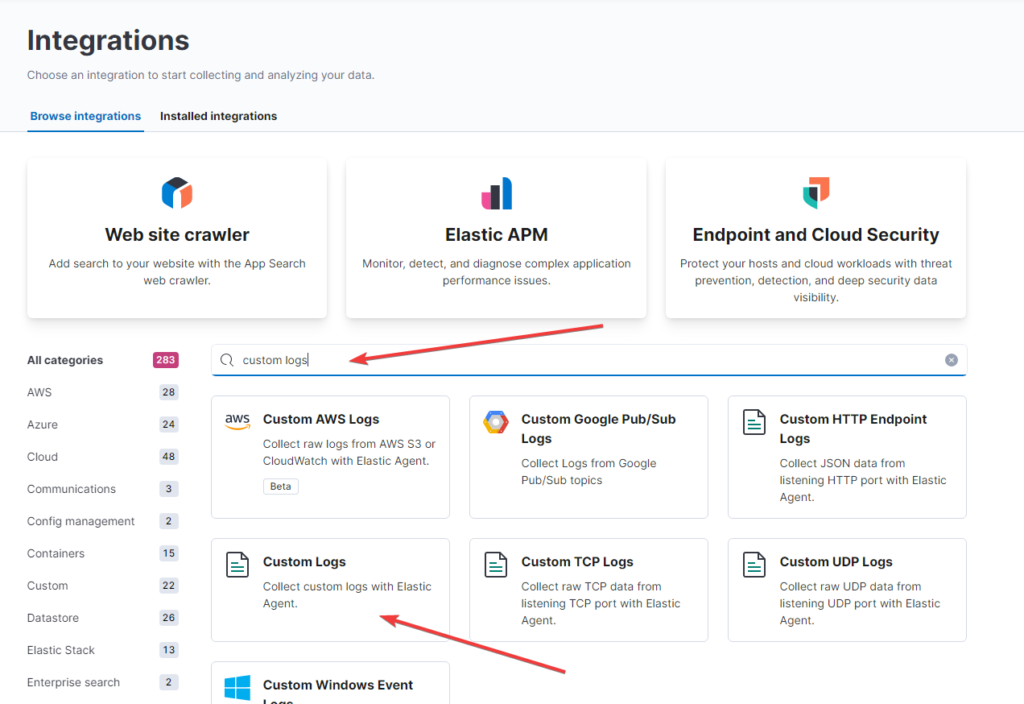
- Add intengration -> search for: custom logs -> open Custom Logs
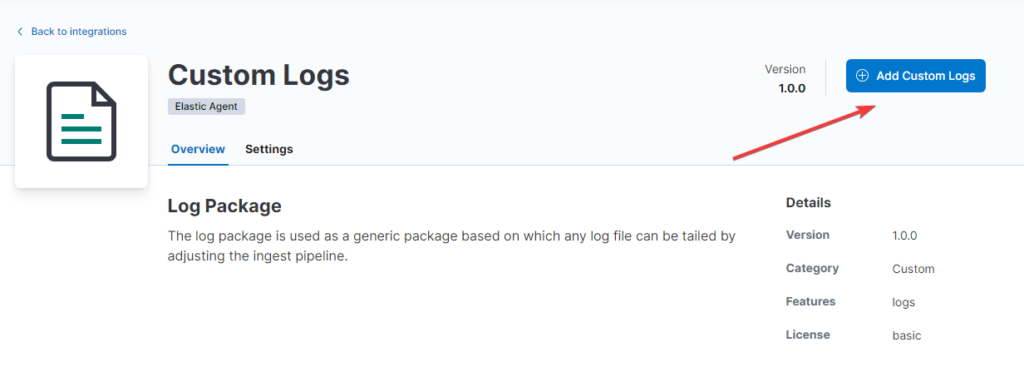
- Add Custom Logs
- Give your Integration a name – I simply call mine logs-iis
- Set a Log file path, the default path is
C:/inetpub/logs/LogFiles/*/*.log - Set
iisas a Dataset name
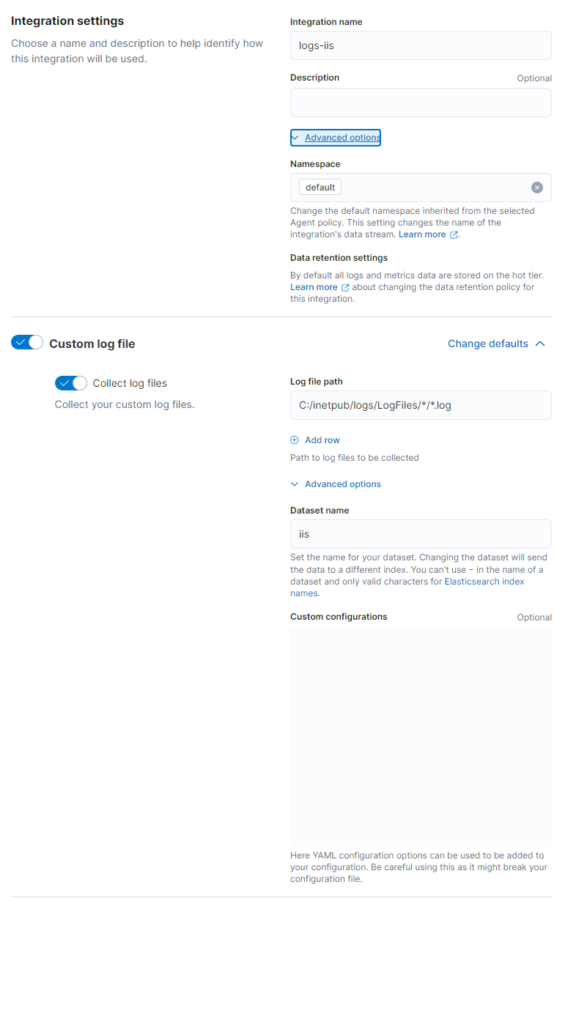
- Check that the right Agent Policy is selected at the bottom
- Finish with a Save and Continue


